Quickstart
RT-EQcorrscan ships with a few scripts. Now that you have the package installed, you probably want to dive right in and see what this puppy can do?
Setup
Let’s get started by making a directory to work in (all the following will be bash commands):
mkdir my_first_detector
cd my_first_detector
Then we need to configure our system. To generate a default configuration file (you can
edit this later) you can run (note that all of these scripts have documentation available using
the --help flag):
rteqcorrscan-config
This will make a YAML file, you can open that and have a look at the configuration in there. Later tutotials will explain some/all of these values in more detail.
Build a database
Now you need a template database. For this quickstart we will make a small database, but you will probably want to make something bigger for your real work.
To make the database run the following:
rteqcorrscan-build-db --config rt-eqcorrscan-config.yml -s 2020-01-01 -e 2020-01-10
This will take a while to run! Grab a beverage of your choice…
This script will build a database of templates using the values in your
configuration file (with the filename specified by the --config flag) between a start-date and
an end-date (specified by the -s and -e options respectively).
Going real-time
Once that has finished you are ready to go! You have a few options here, either simulating an old
sequence (using the rteqcorrscan-simulation script), running a reactor process to react to large events
or high-rate sequences (rteqcorrscan-reactor), or just run a real-time matched-filter process
with your templates.
In this quickstart we will just showcase the real-time matched-filter process because this will (almost) immediately bring us a plot to look at. To see more about all these scripts and those not covered here, checkout the RT-EQcorrscan tutorials.
To run a real-time matched-filter, use the rteqcorrscan-real-time-match script:
rteqcorrscan-real-time-match --config rt-eqcorrscan-config.yml --latitude -41.7 --longitude 174 --radius 1.0
This will query your template database for templates within the region specified by the --latitude,
--longitude and --radius arguments, then start streaming data appropriate for those templates.
It will then periodically scan those templates through the streaming data and make detections.
If you have left the default configuration values you should see a plot pop-up in a browser window that looks something like this (I left mine running for 8 minutes for the plot buffer to start to fill-up), with data streaming in:
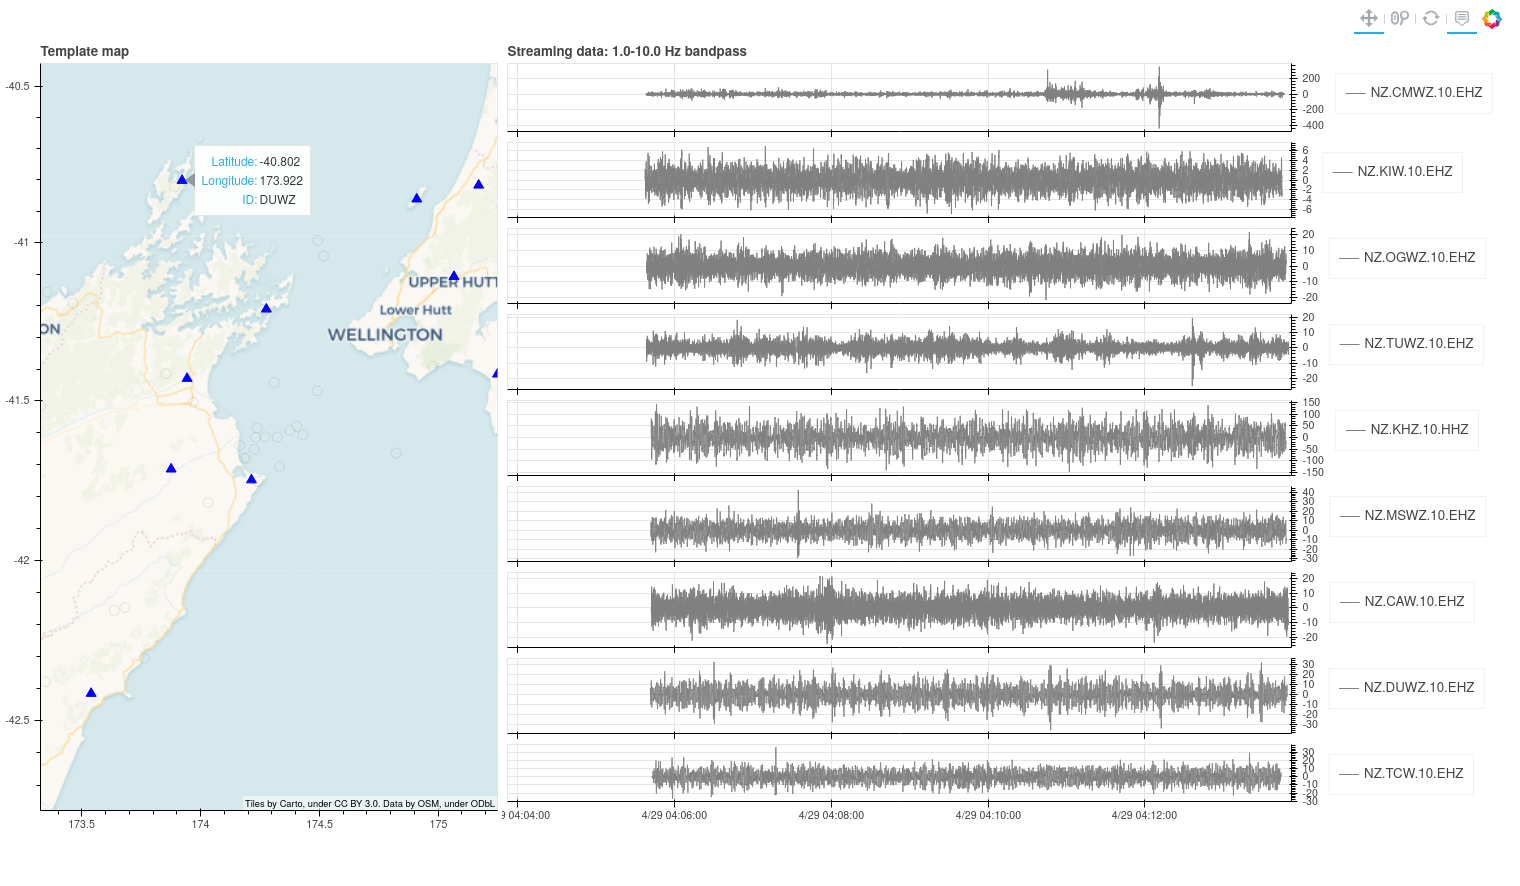
These plots are made up of an interactive map showing stations in use (triangles) and template locations (open circles), and streaming waveform data on the right. Data are filtered according to parameters in your config file, and the bandpass is printed at the top of the plots.
When a detection is made, dashed red lines appear on the waveforms at the pick-times for that detection and the location circle on the map for the template used for detection turns red. Over time the template colour fades.